

Smart Subscriptions Start with Smarter Insights: Inside the Analytics of Easy Subscriptions
Published On: June 20, 2025 - 5 min read
The subscription business model is booming—from streaming services and SaaS tools to subscription boxes and digital memberships. But gaining subscribers isn’t enough. True success comes from understanding them.
That’s where Subscription Analytics becomes your secret weapon.
Whether you’re a startup or a scaling brand, tools like Easy Subscriptions help you unlock actionable insights without spreadsheets or complexity.
What is Subscription Analytics?
Put simply, subscription analytics is the process of collecting, measuring, and analyzing data from your subscription-based business. Unlike traditional sales models, subscriptions involve ongoing customer relationships, which means you need ongoing data insights.
The estimated value of the global subscription economy market is $2,129.92 billion, up from USD 487.0 billion in 2024 to USD 2034 billion, with a compound annual growth rate (CAGR) of 15.9% from 2025 to 2034.
With subscription analytics, you’re not just looking at how many new customers you got this month. You’re analyzing customer behavior over time—how long they stay, when they leave, how much they spend, and what keeps them returning.
Think of it as the command center for your recurring revenue model.
Why Subscription Analytics Matters
Why does this matter so much? Because recurring revenue is powerful, but only when managed wisely.
Subscription analytics helps you:
- Understand your recurring revenue trends
- Identify and reduce churn
- Spot opportunities for upselling and cross-selling
- Make informed decisions about product offerings and pricing based on data insights.
- Forecast future earnings with more accuracy.
If you’re running blind, you’re more likely to lose customers, miss growth opportunities, and leave money on the table.
Getting Started: Key Metrics to Track
Okay, so what exactly should you track?
Here are the must-watch subscription analytics metrics:
1. Monthly Recurring Revenue (MRR)
This is the lifeblood of your subscription business. It tells you how much predictable income you’re making every month.
2. Churn Rate
Churn rate measures the proportion of customers who end their subscription or stop doing business with a company within a certain period. An elevated churn rate can indicate dissatisfaction or other issues that require closer examination.
3. Customer Lifetime Value (LTV)
Customer lifetime value estimates the total income a business can expect from a single customer throughout their entire relationship. It’s a key metric for understanding long-term profitability and the return on investment in customer acquisition and retention.
4. Average Revenue Per User (ARPU)
ARPU indicates the average amount of revenue earned from each customer within a specific period, typically calculated monthly. It provides insight into how effectively your business is monetizing its user base.
5. Customer Acquisition Cost (CAC)
CAC measures the total expense involved in gaining a new customer, including marketing and sales efforts. When compared to Customer Lifetime Value (LTV), it helps determine whether your acquisition strategy is financially sustainable.
Together, these metrics provide a clear overview of your company’s performance and guide data-driven decision-making for future growth.
Turning Insights into Action: Making the Most of Your Data
Analytics are great, but they only matter if you do something with them. Here’s how to move from numbers to real results.
- See the churn spike? Send out win-back emails or run a loyalty promotion.
- High ARPU customers? Look at what they’re buying and create bundles around those preferences.
- Declining MRR? Consider reviewing pricing strategies or investigating potential product issues.
When you treat your analytics like a conversation, your business becomes more agile and more profitable.
Easy Subscriptions: Deep Dive for Shopify Users
If you’re using Shopify Subscription tools to run your business, good news—your analytics are easier to access than ever.
Better yet, they often integrate with external analytics platforms like Google Analytics or Looker, so you can get deeper insights.
For small-to-medium-sized businesses, this means big-league analytics without the enterprise price tag.
Real Example: Reducing Churn in 30 Days
Let’s say you run a monthly coffee subscription. You notice churn has jumped to 15%, and you’re not sure why.
Here’s what you do:
- Dig into your analytics—see if churn is coming from new customers or long-time users.
- Send out a survey—ask why they canceled. Was it cost, quality, or delivery issues?
- Respond fast—if cost is the issue, introduce a “pause” option or a cheaper tier.
- Monitor your changes—check analytics weekly to see if churn drops.
One business using this method reduced churn by 30% in a month. That’s the power of subscription analytics in action.
Quick Feature Summary
What should a great subscription analytics dashboard offer?
- Real-time MRR tracking
- Customizable churn reports
- Customer cohort analysis
- Forecasting tools
- LTV and ARPU insights
- Integration with Shopify and payment gateways
Even if you’re not a data geek, a good dashboard makes it easy to understand the story your numbers are telling.
New Dashboard Analytics Features
Many platforms are stepping up their game when it comes to subscription analytics. Some of the latest features include
- Predictive churn modeling—Estimate which customers are at risk of leaving.
- Customer journey maps—Visualize user touchpoints from signup to renewal or cancellation.
- Segmented reporting—View data by product, geography, or acquisition source.
- AI-powered suggestions—Get recommendations based on patterns in your data.
These aren’t just bells and whistles—they help you take smarter action faster.
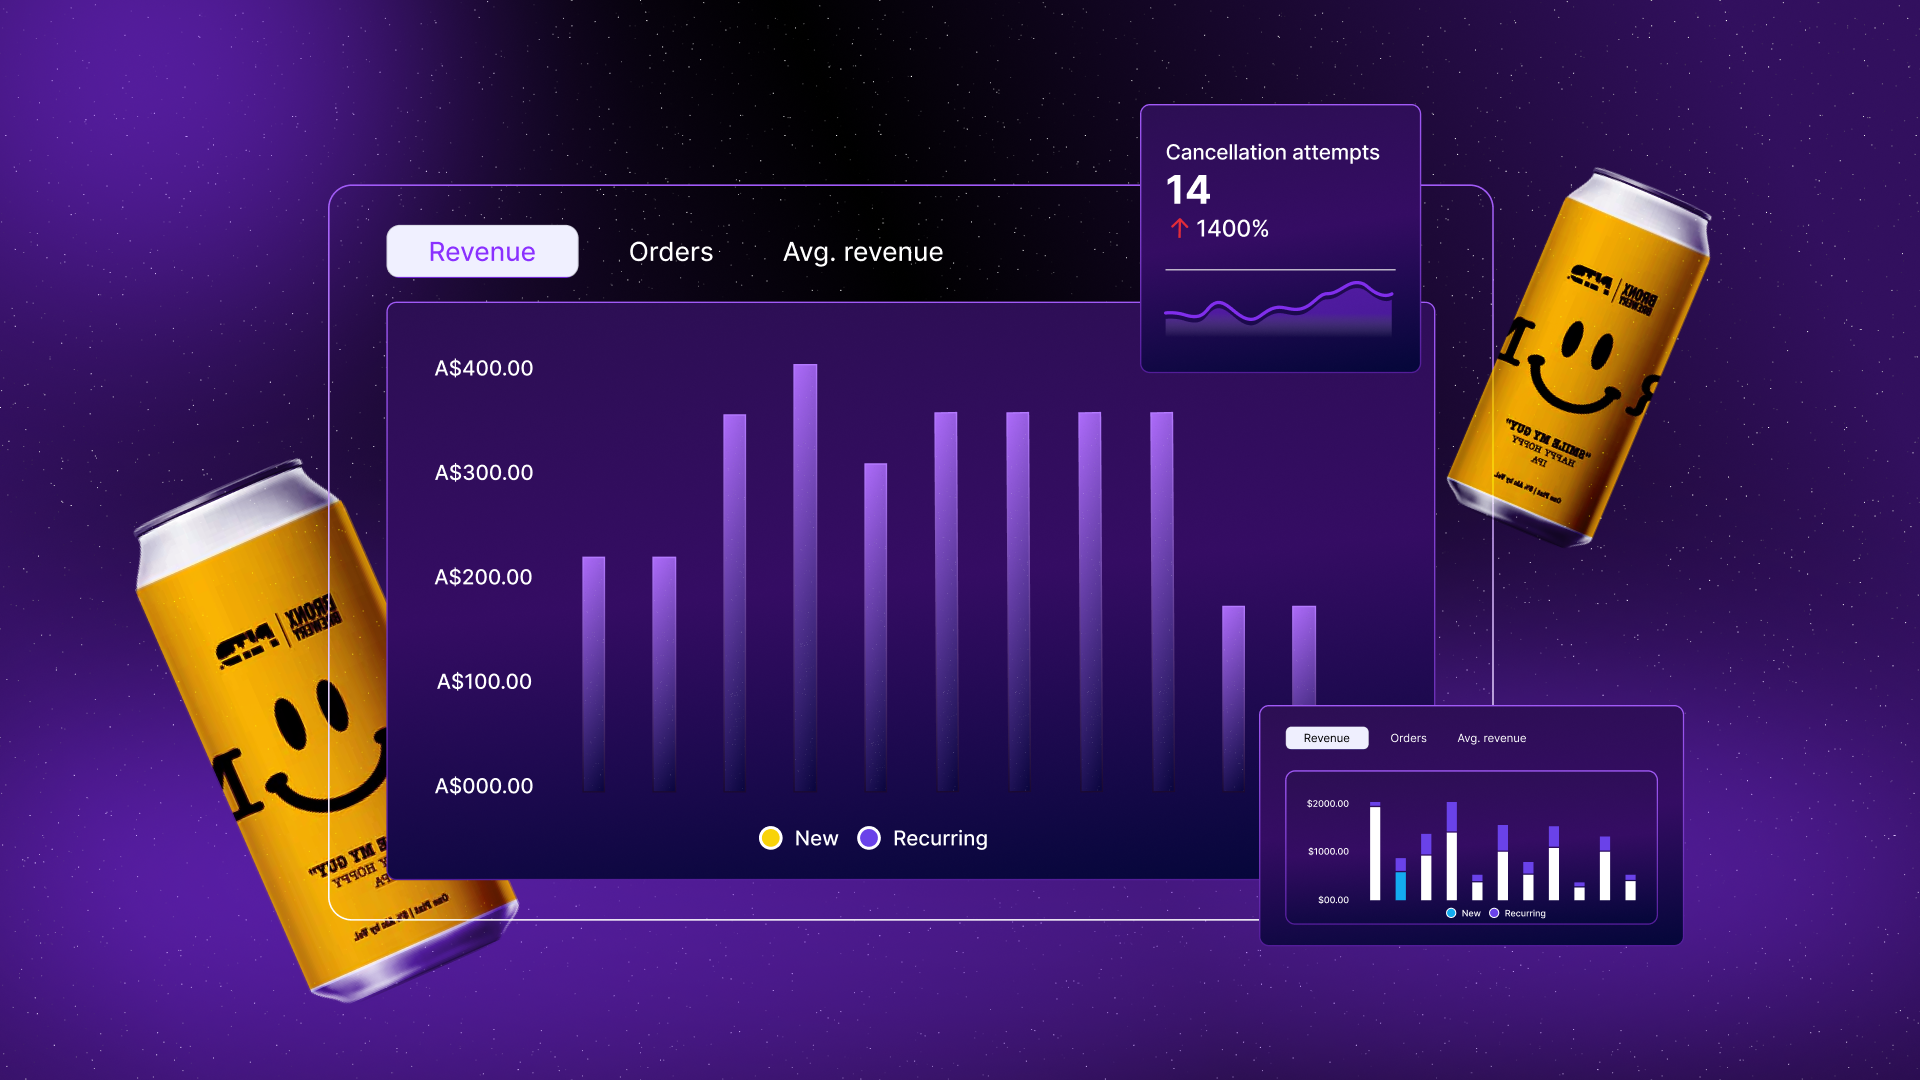
Subscription Analytics Spotlight: Gross, New & Recurring Revenue
One area you should always zoom in on is the revenue breakdown. Look at
- Gross Revenue—Total income from subscriptions
- New Revenue—Revenue from newly acquired subscribers
- Recurring Revenue—Revenue from existing, ongoing subscribers
This spotlight provides insight into finding the right balance between growth and retention. If gross revenue is high but recurring revenue is flat, you’re not retaining customers well. That’s a signal to work on churn reduction strategies.
Your Subscription Analytics Checklist
Before we wrap up, here’s a quick checklist to make sure your subscription analytics game is strong:
- Monitor key metrics weekly
- Segment your customers by behavior
- Test pricing and track the impact
- Use surveys to gather qualitative feedback
- Review dashboard insights monthly
- Forecast revenue quarterly
Consistency is key. Don’t let your data gather dust—use it to evolve your business.
Final Thoughts
Subscription analytics isn’t just a “nice to have.” It’s a must-have for any business looking to grow and sustain recurring revenue. Whether you’re selling skincare, snacks, or software, the better you understand your numbers, the better you’ll serve your customers—and your bottom line.
Especially if you’re on Shopify, using the built-in or integrated Shopify subscription analytics tools gives you a major edge.
Because in the subscription world, success isn’t about one-time wins. It’s about what happens month after month—and smart analytics helps you win every time.
Written by

You might also like...
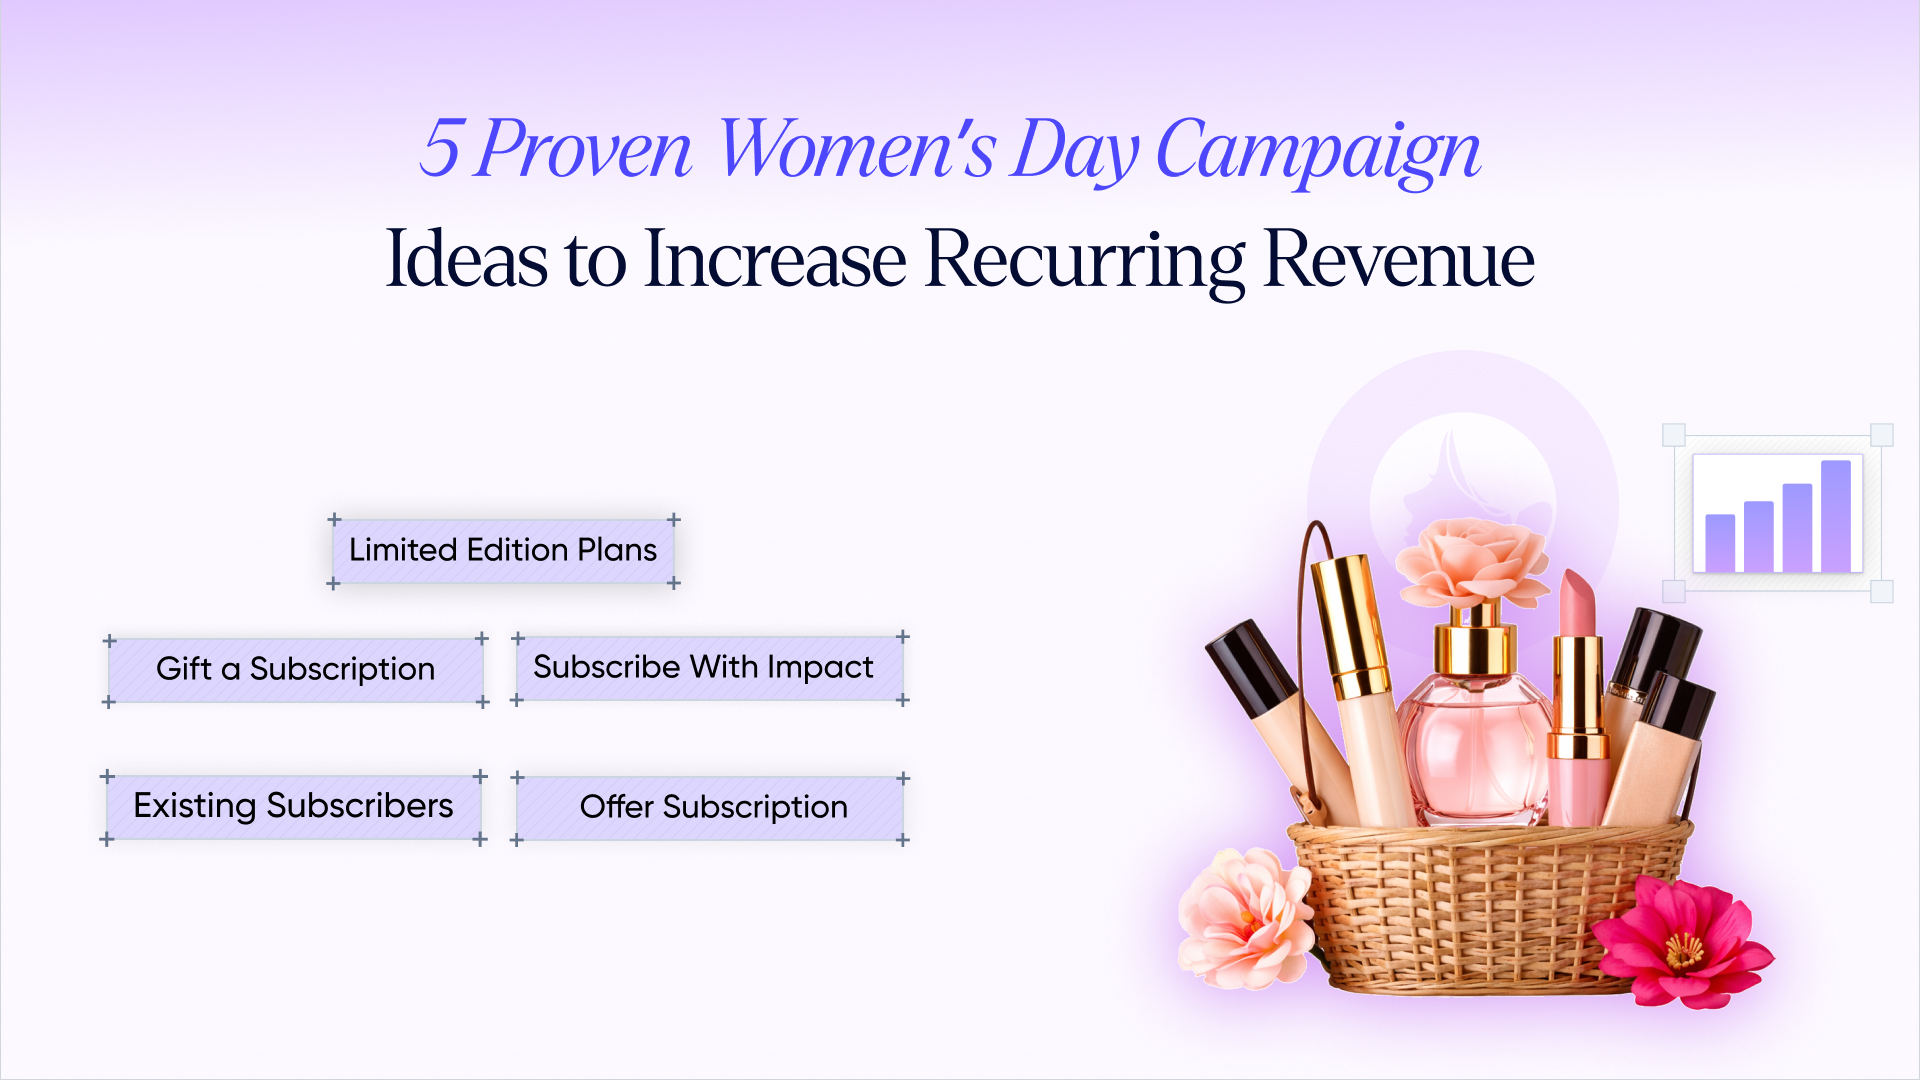
5 Proven Women’s Day Campaign Ideas to Increase Recurring Revenue
Women’s Day is one of the most meaningful moments in the e-commerce calendar. Yet for...
Lara Joe
March 2, 2026
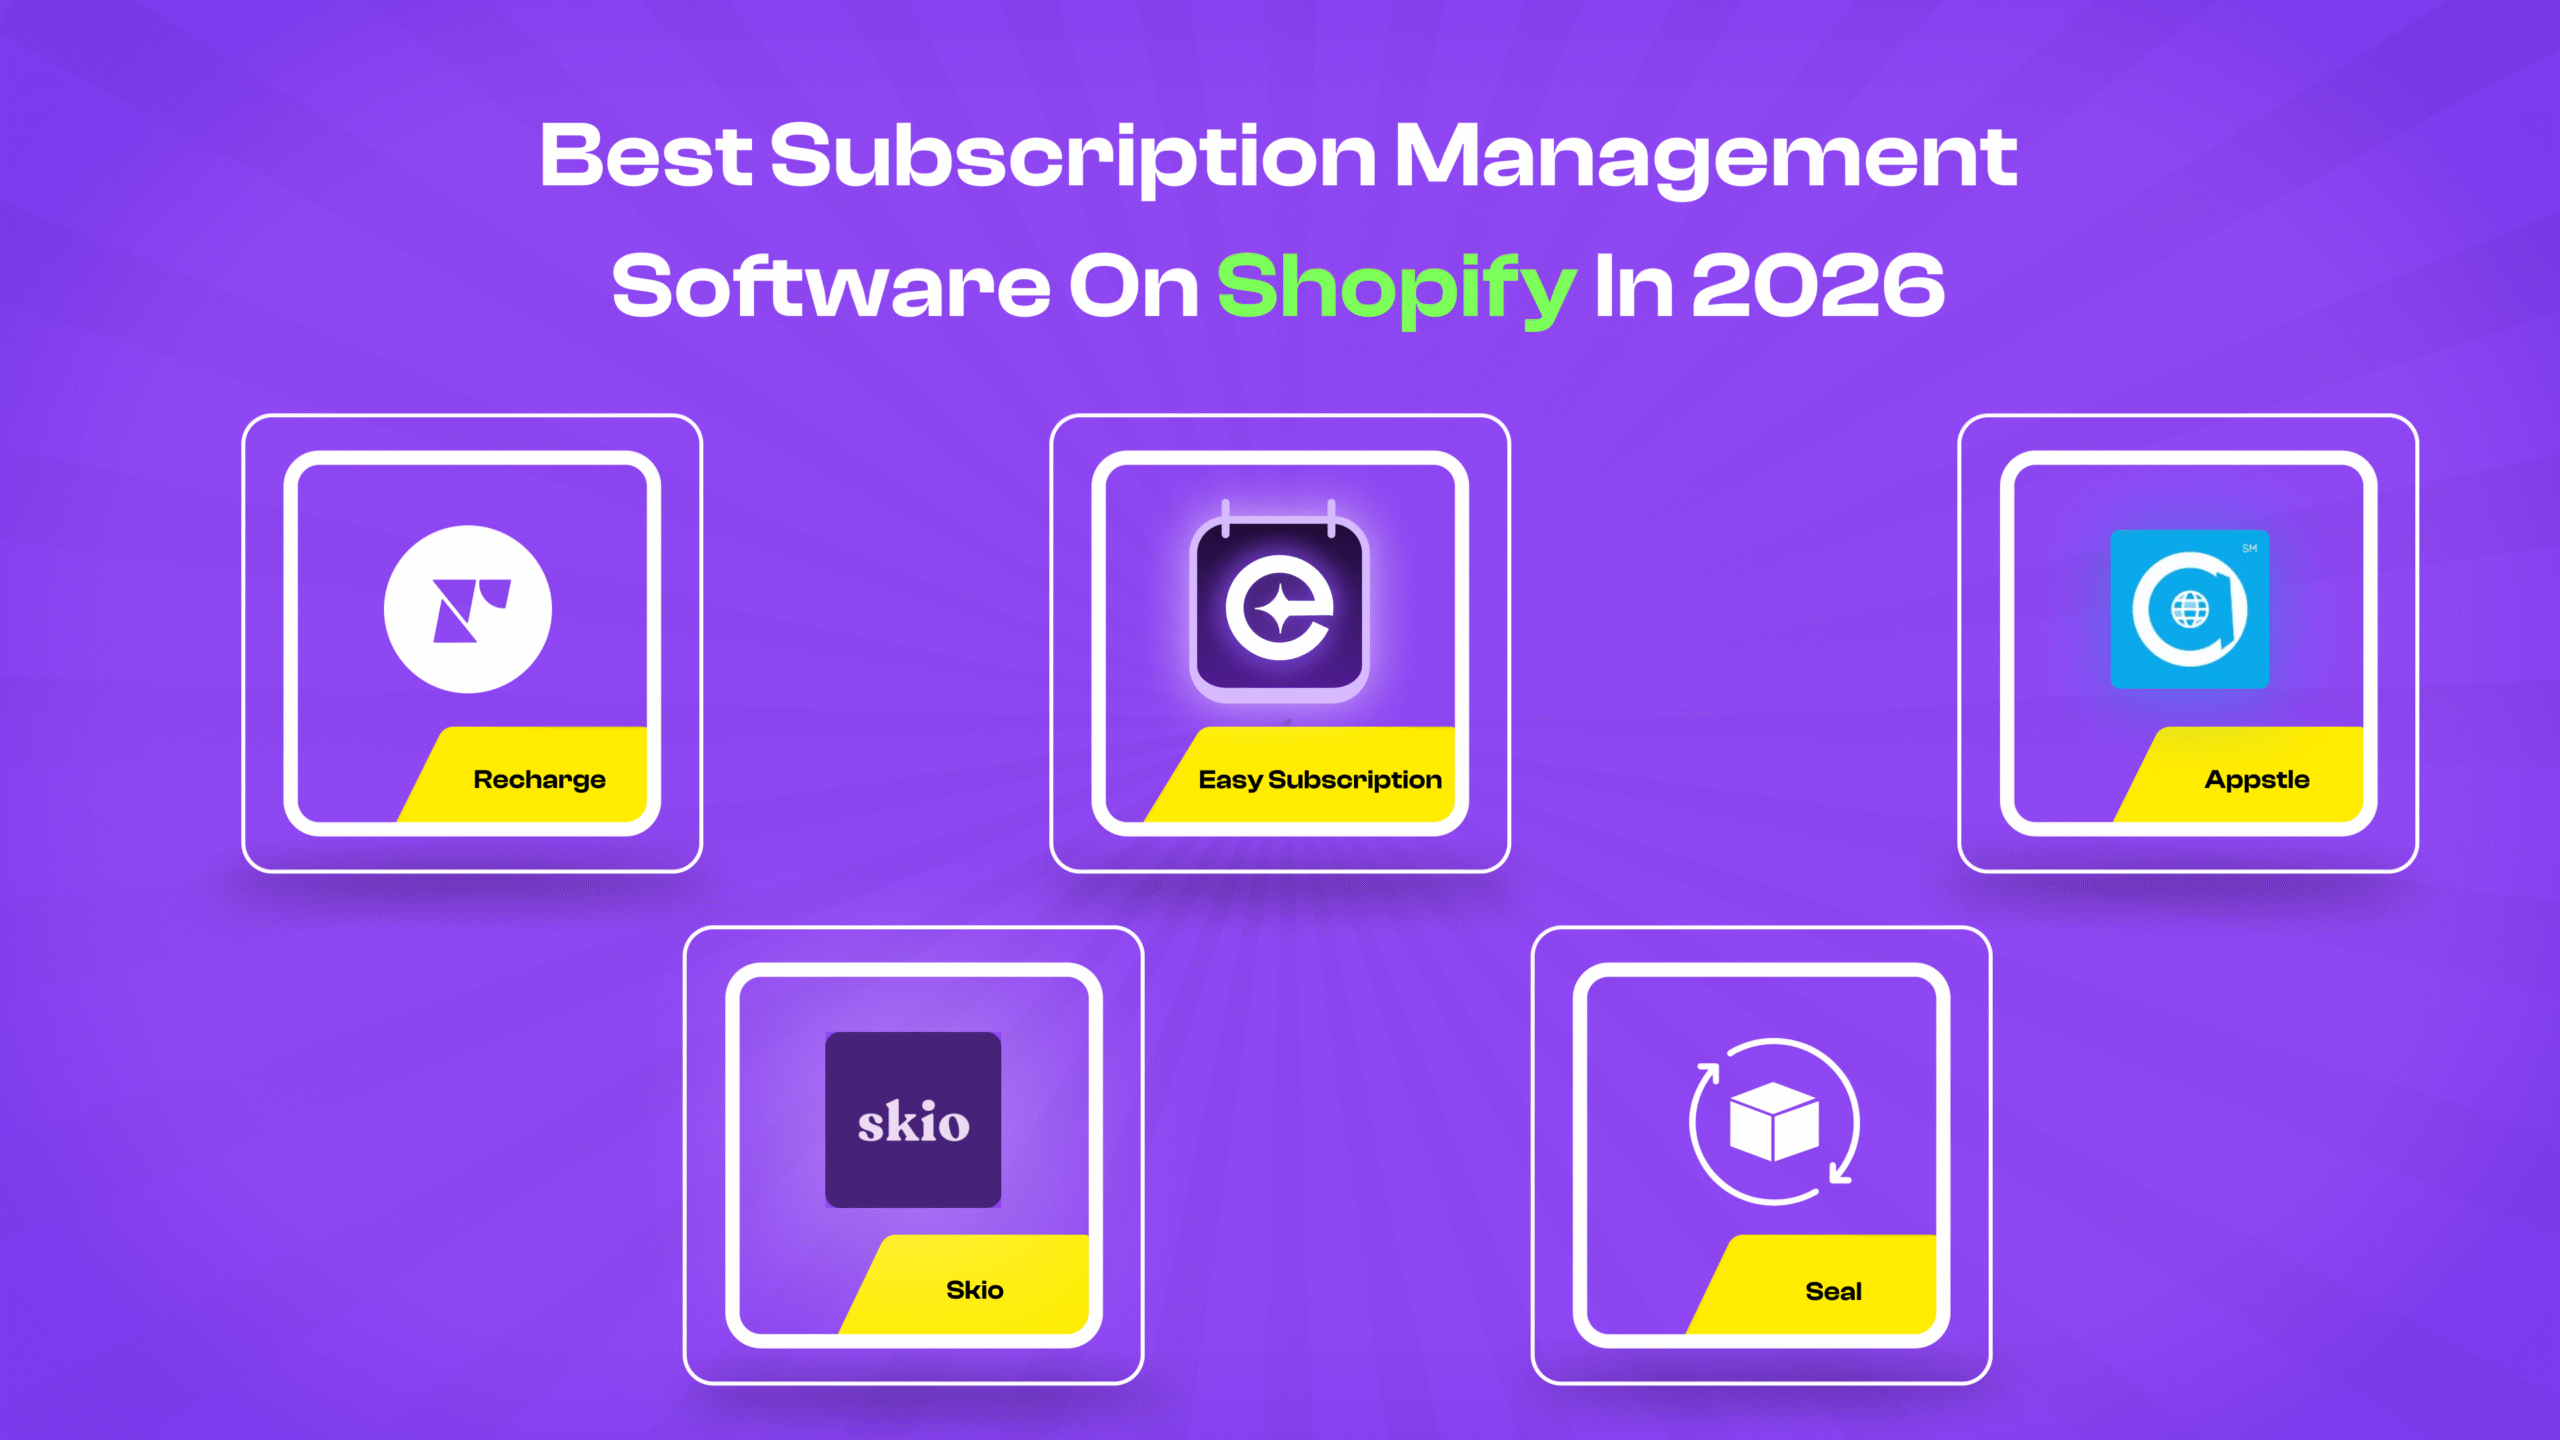
Best Subscription Management Software on Shopify in 2026
The subscription economy has moved from being a growth experiment to a core revenue strategy...
Lara Joe
January 16, 2026